Hence, neuromarketing techniques are new tools proposed to evaluate
the usability of software based on eye-tracking technologies, facial expression
recognition, and galvanic skin response.
According to Gill and Singh (2022), the background of neuromarketing
is associated with the advances in the domain of a group of researchers at
Harvard University integrating different fields of knowledge, which allowed
them to reach additional conclusions, changing the way psychology, neurobiology,
economics, and other related disciplines study the decision-making process. The
results allowed them to provide significant outcomes, such as the one that
states our subconscious level is related to most of our decisions and choices.
With subsequent applications of these studies, the concept of
neuromarketing was born. Lee et al. (2018) provided the most accurate
definition as "the application of neuroimaging to marketing
problems." Subsequent empirical research validates this claim: "Ads
that created the best emotional reaction caused a 23% increase in market volume
over the side effects of traditional promotional techniques" (Wilson,
2002).
According to Wilson (2002), every second, all senses can create an
estimated 11 billion bits, while an individual can process only about 50 bits
of that information, leaving most of the data unnoticed. Under these
conditions, sight has a profound influence on decision-making behavior.
Consequently, science has generally established three critical
moments in acquiring, processing, and interpreting information. The sensory
organs capture the information, the brain processes it, and finally, it is
interpreted, provoking reactions in the test subject that receives the external
stimuli. Although this occurs in micro fractions of time at the brain level,
these three moments always occur in that hierarchy. Based on this logic,
neuromarketing tests have been developed: some seek to study the information
capture process, such as eye tracking; others study the information processing
process, such as electroencephalograms or functional magnetic resonance
imaging; and finally, others delve into the reactions that trigger responses
such as galvanic sensations or facial expressions. Due to the complexity of the
processes and the speed with which these three stages occur, it is only
occasionally possible to perform tests that allow them to be separated, which
are described below (Plassmann et al., 2012):
·
Stage 1. Information gathering (Evidence:
eye-tracking)
·
Stage 2. Information processing (Evidence:
electroencephalogram functional magnetic resonance imaging)
·
Stage 3. Reaction to stimulus (Evidence: facial
expressions galvanic sensations).
Regarding the first stage, Gill and Singh (2022) acknowledges that
to delve into the consumer's reaction to different products or understand the
patterns of gaze permanence in lifelike environments, specialized laboratories
use "eye-tracking" or "eye-tracker," which is a valuable technique
to analyze the places where people look, mainly when the eye fixes its
attention on a certain point. Salabun et al. (2017) states that eye-tracking is
also used with different equipment to measure cognitive response and generate
synergy to obtain the latest insights, especially according to marketing
communication and consumer behavior.
Pupil Labs (2016) expresses that this approach allows establishing
answers to critical questions such as: What does this person feel? What are
they interested in? How distracted or sleepy are they? What is their state of
mental or physical health?
For the development of the second stage, techniques often used are
Electroencephalogram (EEG), which directly measures the cortical activity of
brain waves resulting from neurons communicating. Dynamic brain activity is
captured as a voltage through the event-related potential (ERP), fixed in
duration to particular stimuli, and presented as a function of time. From the
stimulus generation (zero time), they monitor brain waves in response to the
stimuli. Coşkun and Yücel (2021) applied EEGs to evaluate websites,
finding that colours, reference points, and the feeling of missing
opportunities are essential to consumers.
Regarding the third stage, science has been developing new
methodologies to understand the emotional reactions of subjects to stimuli by
reading facial expressions, which are in the group of tests that are not
neuroimaging and allow obtaining equally valuable inputs of information. In
this sense, specialized software has been developed that incorporates
face-reading algorithms with artificial intelligence based on the
interpretation of millions of videos of faces. Academic experts provide the
interpretation of faces and specialize in performing analysis of them and their
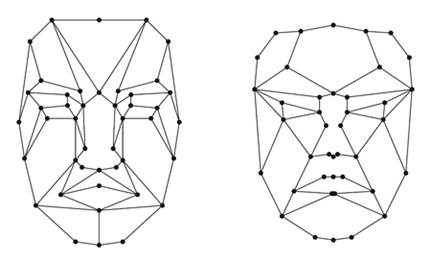
emotions. In order to carry out these interpretations, the system fixes points
on the face, such as the jaw, eyebrows, mouth, eyes, nose, or others, to
reference the expressions. Figure 1 shows an example of how the system works.
Figure 1.
Fixation points for reading facial expressions
Note: Adapted from https://es.123rf.com/
Specialized software algorithms classify image frames into more
general groups of reactions (positive, negative, or neutral) and identify
emotions such as anger, attention, confusion, contempt, disgust, commitment,
fear, joy, sadness, and surprise. With the correlation of these results, it is
possible to infer stimuli or sections that may or may not help assess the
objectives of the stimuli.
Studies based on skin reactions use galvanic skin response meters
(galvanic skin response - GSR) through sensors that measure the electrodermal
activity—establishing a physiological indicator that indicates a more
significant amount of sweating, improving electrical conductance (Moya et al.
2020), allowing to induce an emotional impact in real time of the stimuli.
METHODOLOGY
For the development of the investigation, the researcher attended
the following steps:
Step 1.
Description of the software
Judit Inteligencial Judicial is a legal-tech tool that offers
information on judicial procedures in Ecuador from 2016 to 2021, incorporating
data analytics retrieved from the information published in the Judicial
Function System, seeking to identify patterns, trends, and statistically
significant relationships, allowing to improve legal argumentation, refine
strategies, facilitate decision-making and personalization of legal services.
This information is the most valuable asset that the tool has. It
required the creation of a "web scraping" code, which raised 80 GB of
information from judicial processes, which go through an algorithm of
information classification that allows transforming all the cases raised into
relevant statistics, having so far processed information from more than 36
million actions grouped into 1.3 million judicial processes, classified into
1377 matters. At this time, the mining process continues running. This way, it
can contain and analyze a significant percentage of Ecuador's judicial
processes and cases.
The first module, Analytics, generates a first statistical approach
to the judicial situation in Ecuador. It has graphs with the available
information, the leading causes, and the geographical distribution.
The following module is about legal cases, which allows the
generation of information on law according to the type of judicial process. It
has a filter module that allows anyone to define the information that will be
displayed. It presents the graphs of judges' acting times, trends in judgment,
filters by the court, and information in PDF documents on the actions of the
different legal procedures.
The court module generates information on jurisprudence according to
territorial parameterization. To comply with this function, it has an
information filter section, which, once applied, allows viewing time
information, trends in judgment, and obtaining information in PDF documents.
The following module, Judges, focuses on collecting information from
a particular judge. Once this is selected, it displays contact information and
the option to filter the details of their actions based on a period at the
user's convenience. Subsequently, it will display statistical information
similar to the previous modules.
Step 2.
Measurement development
Selecting measurements available in the software
Imotions used for capturing information and parametrizing test subjects'
reactions. The experiment does not consider brain processing measurements.
Additionally, a questionnaire was applied to verify the validity of the
previous results and delve into the causes of the observations made. Table 1
summarizes the instruments employed and the indicators related to each one.
Table 1.
Instruments and indicators used
|
Stage
|
Instrument
|
Indicators
|
|
Data collection
|
Eye tracker
|
Fixations and gaze points
Saccades
Time spent (dwell time)
Heatmaps
Fixations sequences
|
|
Generated reaction
|
GSR
|
Peaks of emotional arousal
Spikes per minute
Average Peak Amplitude
|
|
Facial expressions
|
Emotions detected
Time by emotions
|
|
Post-processing
|
Questionnaire
|
Appreciation
Complexity
Relevant information
Information assessment
Recommendations
|
Step 3.
Determination of the sample for analysis
The experiment considered a convenience sample of six study
subjects. All are linked to the law field of study (two are law students and
four are legal professionals), equally distributed among students, recently
practicing lawyers, and lawyers with more than 15 years of experience. The
study participants were three men and three women, with an average age of 32.6
years. The oldest participant is 49, while the youngest is 22 years old. To
encourage participation, a raffle for prizes was held for the participants.
Informed consent was guaranteed, and the confidentiality of the individual
identification data of the participants was guaranteed.
Step 4. Gathering
data
Before starting the experiment to gather data, we
explained the software's purpose, characteristics, and structure to the
participants. They were allowed to navigate freely for 5 minutes. Subsequently,
each participant has to fulfill the following tasks:
Task 1: In the analytics
module, determine the following:
·
What is the process that is the second most
analyzed?
·
In 2016, which process had the most extended
average duration?
Task 2: In the legal cases
module, obtain information from the following legal procedures:
·
Topic: Legal protection
·
Practice: Family, woman, childhood, and
adolescence
·
Filter by Azuay province
·
Filter by Guayas province
·
Get the PDF of one of the process outcomes of
the filter application.
Task 3: In the court module:
·
Obtain information for the province of
Pichincha, Quito canton, specialized Court of the Family, Childhood,
Adolescence, and Adolescent Offenders, Provincial jurisdiction.
·
Obtain information for the province of Manabí,
Manta canton, and the Court of Criminal Guarantees of Manta.
·
Get the PDF of one of the process outcomes of
the filter application.
Task 4: In the judge module:
·
Filter at least two judges.
·
Get the PDF of one of the process.
·
Outcomes of the filter application.
While the participants complete the tasks, their interaction will be
recorded in front of a monitor configured to access the web page under
evaluation. It is essential to mention that when the test subject was
interacting freely on the web page, the time the stimulus was considered
"asynchronous," meaning that the free navigation and the execution of
the assigned tasks were not performed simultaneously. Once the test subjects
finished the tasks, they responded to a questionnaire designed in three parts,
with 13 aspects related to the platform's usability.
General evaluation of the tool (a Likert evaluation scale):
·
How would you rate your experience using the
tool?
·
Is the tool easy to use?
·
Did the tool have been easier to use or more
precise? Which elements and why?
·
How useful do you encounter the information
provided by the tool?
·
Do you consider it an efficient and effective
tool to carry out your tasks?
Module evaluation. Rate each of the modules on a scale of 1 to 5 on each of the
following attributes:
·
Easy to use
·
The usefulness of the information
·
Information graphics
·
PDF reports (PDF generation)
·
What would you recommend to improve the module?
Willingness to foster its use:
·
Would you recommend the tool?
·
Why would you do it?
Step 5. Information processing
We gather data by utilizing specialized software to infer stimuli or
sections that may or may not be helpful to the user. In addition, the galvanic
skin response meter (GSR) data is correlated. It is a sensor that measures the
electrodermal activity of the skin to induce an emotional impact in real time
of the stimuli.
A timestamp tag was used as the unit of analysis. It allows us to
determine the module the user is navigating, helping to discriminate the data
retrieved from the gaze sensor, facial expressions, and electrodermal activity
peaks and presenting each result. As part of the evaluation throughout the
completion of the tasks, time was considered as another indicator of the
software's functionality. We assume it has a good design if the user gains
skills during the experience and completing tasks. Therefore, the time spent
should decrease. Additionally, we use the information from the processed
questionnaire.
RESULTS
Eye tracking
According to the description of the methodology, the results are
presented below:
Analytics module: We identified three
points of gaze concentration: the graph of the number of legal cases per year,
the number of legal cases by province, and the word cloud with the top 10 most
dealt cases by the Ecuadorian justice system. The territorial distribution of
the processes also caught the participants' attention based on the interest
generated by the information. Many of them clicked on the provinces, waiting to
display information by province, which suggests that developers could add this
functionality.
In this module, the experiment required identifying the process with
the most prolonged average duration in 2016, represented in the final graph of
the analytics page, called "Average duration per subject/year."
However, the gaze did not focus on the expected area of interest with the
correct answer. The outcome could be interpreted as a lack of clarity in the
graph and, consequently, could lead to confusion.
Legal causes module: In this case, the
gaze concentration suggests a greater diversity in the points of attraction. In
the section on statistical analysis, the sight concentrates on the pie graph
legends, which implies an interest in these results. The section on topics with
more resolutions by trends in judgment shows an apparent concentration of gaze
related to the Western reading pattern, from left to right, focusing on the
left graph. The right one shows less relevance due to the influence of the
prior analysis. In the heading of "courts with the most verdicts
ruled", the results reveal a certain level of relevance. The results also
indicate the need to improve the data reporting due to a functionality failure
associated with the territorial map of Ecuador and its update.
The analysis of cases by province and the sex of the judge also
showed a high level of gaze concentration. On the other hand, the information
regarding the distribution of cases by year was not a point of interest. The
evolution of the rulings classified by their trends in judgment was another
area of interest, especially in the females.
Court module: The gaze tends to be less
focused and concentrated in fewer places. However, it is relevant to analyze
the duration of the legal cases, the trends in judgment in favor of the
defendant, the number of processes per year, and the judges who handed down the
most rulings.
Judges module: The result indicates that
the attention was on the institutional information displayed for any judge. The
section that most attracted users' attention was those on processes by topic
and culmination state, which implies that knowing the prominent matters dealt
with by the judge is relevant information. Another section that focuses
attention is the cases with the most resolutions classified by the ruling trends,
repeating attention to the data that allows analyzing the trend in favor of the
offended party ruling. The rest of the sections showed little influence of gaze
concentration.
Facial expressions
The observed results are expressed according to the
percentage of time and the expression demonstrated (see Table 2).
Table 2.
Percentage of total exposure
time at the marker with facial expressions detected
|
Module
|
Anger
|
Sadness
|
Disgust
|
Fear
|
Contempt
|
Joy
|
Surprise
|
Commitment
|
Attention
|
|
Analytics
|
0.04
|
0.34
|
0.02
|
0.21
|
0.00
|
0.48
|
1.06
|
4.72
|
91.02
|
|
Cases
|
1.45
|
0.66
|
0.07
|
4.11
|
0.14
|
1.20
|
0.67
|
13.40
|
93.27
|
|
Court
|
0.29
|
0.20
|
0.14
|
1.61
|
2.15
|
0.58
|
0.00
|
17.07
|
99.18
|
|
Judge
|
0.00
|
0.46
|
0.00
|
0.00
|
0.00
|
0.00
|
0.00
|
1.99
|
95.49
|
|
Average
|
0.43
|
0.29
|
0.13
|
1.01
|
0.25
|
1.56
|
0.48
|
8.83
|
95.71
|
As expected in a usability experiment with a new website, the
primary emotion was attention. Overall, this was demonstrated for 95.7% of the
exposure time, followed by the emotion called engagement, recorded for 8.83%.
The rest of the emotions are at most 2% of the time, so their registration and
study are not significant.
To the previously exposed emotions, the software has an algorithm
that analyzes whether the detected emotion is positive, negative, or neutral.
The results reveal that the neutrality of attention and commitment is the most
frequent, recording it 98% of times. The positive and the negative have similar
and insignificant numbers (See Table 3).
It is crucial to indicate that it is relevant that the positive
emotion has exceeded the negative in the course of the experiment, which
implies satisfaction during the interaction designed for this situation, which
allows us to infer that the user felt comfortable exploring the web page, and
the information displayed caught the attention of users, generating a value
perception.
Table 3.
Positive, negative, or neutral
emotions detected in facial expressions analysis
|
Module
|
Positive
|
Negative
|
Neutral
|
|
Analytics
|
0.39
|
0.66
|
98.95
|
|
Cases
|
1.97
|
1.11
|
96.77
|
|
Court
|
2.13
|
0.99
|
96.49
|
|
Judge
|
0.00
|
1.36
|
98.07
|
|
Average
|
1.41
|
1.18
|
97.42
|
Note: Percentage of total exposure time.
Galvanic Skin Response - GSR
The results of this analysis allow us to indicate the
number of exaltations peaks each module can generate and their intensity. Based
on the results (See Table 4), there are few peaks. However, these are important
to analyze because they will corroborate the type of emotion generated by the
new software.
Table 4.
Overall Results by Experiment
Marker for GSR
|
Module
|
Peak count
|
Average Peaks per minute
|
Average Peak Amplitude
|
|
Analytics
|
59
|
2.07
|
0.03
|
|
Cases
|
29
|
2.37
|
0.07
|
|
Court
|
18
|
1.81
|
0.07
|
|
Judge
|
2
|
2.55
|
0.07
|
|
Average
|
18.29
|
2.21
|
0.06
|
It is critical to indicate that the analytical function has the
highest number of peaks; however, it is also noteworthy that as the experiment
participants became more familiar with web browsing, the number of peaks
decreased, as did the average time spent browsing each of the modules to
complete the assigned activities.
The results of the average peak amplitude indicate the same behavior
in the modules except for the analytical one, which was relatively lower. It is
also due to the many peaks recorded and participants spending more time in this
module. Therefore, the longer the time, the less intensity of emotions showed
when discovering new functionalities. Table 5 shows the behavior in time of
each measurement and task.
Table 5.
Number of valid shots per
experiment marker and accumulated time
|
Module
|
Aggregate time (milliseconds)
|
Average (milliseconds)
|
|
Analytics
|
2532894
|
422149
|
|
Cases
|
2081916
|
346986
|
|
Court
|
1209366
|
201606
|
|
Judge
|
254975
|
50995
|
|
|
|
|
As long as the user performs any task, the time required to complete
them is shorter, which is evidence that the modules present a similar level of
complexity and that the skills in using the software are on the rise if the
users spend more time on it. It also confirms the existence of an intuitive
navigation design.
Application of the questionnaire
As a general perception, the participants suggest easiness when
managing the web page, the data reported interpretation, and executing the
proposed tasks. Also, they declared that the data leak was immediate and
provided essential information such as mail and telephone numbers appearing in
the magistrate section.
It was possible to establish that the indicated deficiencies
generally came from people of advanced age and high experience in the field who
suggested showing the software to local institutions related to the domain.
Analytics module: It was recognized that some participants could not
understand the graphics presenting the outcomes, establishing as a cause that
the diameters of each circumference are similar. They recommended organizing
the information by tabs and increasing the interaction using clicks on the
graphs, allowing a deeper exploration of the information disaggregation and
completing the search module for more specific cases based on the users' needs.
Judges module: Users recommended to include the comparison function
between magistrates.
Cases and court modules: No suggestions for improvements.
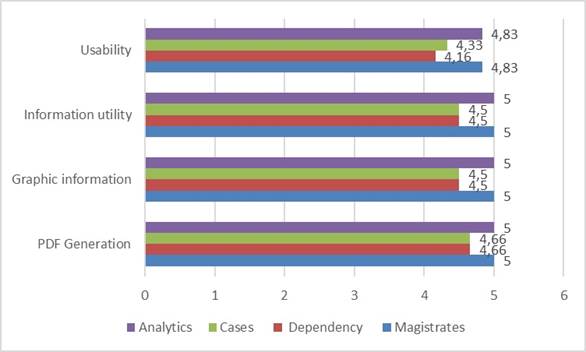
As part of applying this technique, the performed evaluation of the
different modules is summarized in Figure 2. As noticed, all modules present
evaluations higher than 4 points. The attributes of the usefulness of
information, graphic information, and PDF generation reached the highest rating
in the judges and analytical modules. They are slightly lower in the remaining
two. Ease of use was the attribute with the lowest evaluation.
Figure 2.
Module appraisal
The results achieved constitute one more
contribution to the efforts related to evaluating software usability (Norman
Acevedo et al., 2015; Massaro et al., 2021; Nielsen & Molich, 1990;
Shneiderman, 2005). The application of neuromarketing allows for an increase in
the objectivity of the evaluations. The results of the analysis of gaze, facial
expressions, and galvanic sensations corroborate previous research approaches
(Pascucci et al., 2022; Zahmati et al., 2022; Hammond et al., 2022; Ohme et al.,
2009; Xu et al., 2023; Gill & Singh, 2022; Sałabun et al., 2017). Similarly,
the evaluation of the studied web page corroborates the results presented by
Coşkun and Yücel (2021), who highlighted the role of colours, the
reference point in software design (Moya et al., 2020).
The methodology described for evaluating software presents multiple
applications in the managerial environment by allowing the evaluation of any
software in advertising, management, or information. The evaluation of software
based on neuromarketing techniques, on the one hand, allows for an increase in
the objective nature of the evaluation and, on the other hand, to identify
opportunities for improvements in the applied computer.
The results achieved are part of a set of limitations that must be
taken into consideration. The research's limitations are related to evaluating
software developed in a web environment, whose purpose is to present
information related to legal knowledge. It would be advisable to apply the
methodology described in web environments linked to sectors such as tourism and
gastronomy. The sample size needs to be more extensive; consequently, the
results should not be considered conclusive. From an integration perspective,
the results would be more robust if the brain process measurements were carried
out to analyze the information under evaluation from the application of
electroencephalogram (EEG) or functional magnetic resonance imaging (fMRI)
techniques.
CONCLUSIONS
The integrated analysis of the results of
the different tests applied made it possible to confirm its general
functionality and recognize opportunities for improvement. The main conclusion
of the experiment indicates that the cases and judges’ modules are the ones
that have the most significant value for the user due to correlating the
results of facial expressions, GSR, eye tracking with the final questionnaire
and the assessment they gave to each module.
In the same way, the time reduction in the modules implies a rapid
adaptation to the information displayed by the portal. The levels of attention
and commitment observed show the utilitarian and functional nature of the web
page. As a general conclusion, positive emotionality showed higher levels than
negative, allowing us to infer high levels of satisfaction during the designed
interaction. These subconscious results correlate with those obtained in the
data gathered from the experiment.
Maps and graphics showed a more remarkable power to attract
attention. A tendency to review the information following the established sense
of reading was corroborated.
It was also identified an implicit need for more significant
interaction at the different levels of information reports, as well as
increasing the existence of drop-down menus when information is required to be
filtered, expanding the use of tabs with data sets to avoid overwhelming the
user with diverse statistical data and incorporating more options for
comparison between variables.
BIBLIOGRAPHIC REFERENCES
Agarwal, S., & Xavier, M.J.
(2015). Innovations in consumer
science: Applications of neuro-scientific research tools. In Brem, A. & É. Viardot
(Eds), Adoption of Innovation: Balancing Internal and External
Stakeholders in the Marketing of Innovation (pp. 25-42). Springer, Cham. https://doi.org/10.1007/978-3-319-14523-5_3
Alonso Dos Santos, M.,
Calabuig Moreno, F., & Crespo-Hervás, J. (2019).
Influence of perceived and effective
congruence on recall and purchase intention in sponsored printed sports
advertising: An eye-tracking application. International Journal of Sports
Marketing and Sponsorship, 20 (4), 617-633. https://doi.org/10.1108/IJSMS-10-2018-0099
Alvino, L., van der Lubbe, R., Joosten, R.A.M., & Constantinides,
E. (2020). Which wine do you prefer? An
analysis on consumer behaviour and brain activity during a wine tasting
experience. Asia Pacific Journal of Marketing and Logistics, 32 (5), 149-1170.
https://doi.org/10.1108/APJML-04-2019-0240
Baldo, D., Viswanathan, V.S., Timpone, R.J., & Venkatraman, V.
(2022). The heart, brain, and body of
marketing: Complementary roles of neurophysiological measures in tracking
emotions, memory, and ad effectiveness. Psychology and Marketing, 39 (10),
1979-1991. https://doi.org/10.1002/mar.21697
Bouvard, J. (1970). Fourth
Generation Software. The User’s Prospective. Honeywell Computer Journal, 4
(2), 42-49.
Bulley, C.A., Braimah, M.,
& Blankson, F.E. (2018). Ethics, neuromarketing and marketing research with
children. International Journal of Customer Relationship Marketing and
Management, 9 (2), 79-95. https://doi.org/10.4018/IJCRMM.2018040105
Bulut, Y., & Arslan, B. (2020).
The science behind neuromarketing. In Atli, D. (Ed), Analyzing the
Strategic Role of Neuromarketing and Consumer Neuroscience (pp. 104-126).
IGI Global. https://doi.org/10.4018/978-1-7998-3126-6.ch006
Cha, K.C., Suh, M., Kwon,
G., Yang, S., & Lee, E.J. (2020). Young consumers' brain responses to
pop music on YouTube. Asia Pacific Journal of Marketing and Logistics,
32 (5), 1132-1148. https://doi.org/10.1108/APJML-04-2019-0247
Cherubino,
P., Cartocci, G., Modica, E., Rossi, D., Mancini, M., Trettel, A.,
& Babiloni, F. (2018). Wine Tasting: How
Much is the Contribution of the Olfaction? In Nermend, K. & M. Łatuszyńska
(Eds), Problems, Methods and Tools in Experimental and Behavioral Economics.
CMEE 2017. Springer
Proceedings in Business and Economics (pp. 199-209). Springer, Cham.
https://doi.org/10.1007/978-3-319-99187-0_15
Cherubino,
P., Trettel, A., Cartocci, G., Rossi, D., Modica, E., Maglione, A.G.,
Mancini, M., di Flumeri, G., & Babiloni, F. (2016). Neuroelectrical Indexes for the Study of the Efficacy of TV
Advertising Stimuli. In Nermend, K. & M. Łatuszyńska (Eds), Selected
Issues in Experimental Economics. Springer Proceedings in Business and
Economics (pp. 355-371). Springer, Cham. https://doi.org/10.1007/978-3-319-28419-4_22
Coşkun, P., & Yücel,
A. (2021). An Experimental Study on Consumers' Perceptions of Electronic
Commerce Sites with EEG Method. Süleyman
Demirel Üniversitesi Vizyoner Dergisi, 12 (29)m, 286-298. https://doi.org/10.21076/vizyoner.720686
Covino, D., Viola, I., Paientko, T., & Boccia, F. (2021). Neuromarketing: Some remarks by an economic experiment on food
consumer perception and ethic sustainability. Rivista Di Studi Sulla Sostenibilita, 1, 187-199. https://doi.org/10.3280/RISS2021-001011
De Oliveira, J.H.C., & Giraldi, J.M.E. (2019). Neuromarketing and its implications for operations management: An
experiment with two brands of beer. Gestao e
Producao, 26 (3). https://doi.org/10.1590/0104-530X3512-19
Di Flumeri, G., Herrero, M.T., Trettel, A., Cherubino, P.,
Maglione, A.G., Colosimo, A., Moneta, E., Peparaio, M., & Babiloni, F. (2016).
EEG Frontal Asymmetry Related to
Pleasantness of Olfactory Stimuli in Young Subjects. In Nermend, K. & M. Łatuszyńska
(Eds), Selected Issues in Experimental Economics. Springer Proceedings in
Business and Economics (pp. 373-381). Springer, Cham. https://doi.org/10.1007/978-3-319-28419-4_23
Garczarek-Bąk, U.,
Szymkowiak, A., Gaczek, P., & Disterheft, A. (2021). A comparative analysis
of neuromarketing methods for brand purchasing predictions among young adults. Journal
of Brand Management, 28 (2), 171-185. https://doi.org/10.1057/s41262-020-00221-7
Gill, R., & Singh, J. (2022).
A study of neuromarketing techniques for proposing cost effective information
driven framework for decision making. Materials Today: Proceedings, 49 (8), 2969-2981. https://doi.org/10.1016/j.matpr.2020.08.730
Gómez-Carmona, D.,
Marín-Dueñas, P.P., Cano-Tenorio, R., Serrano Domínguez, C., Muñoz-Leiva, F.,
& Liébana-Cabanillas, F. (2022). Environmental concern as a moderator of information processing: A
fMRI study. Journal of Cleaner
Production, 369. https://doi.org/10.1016/j.jclepro.2022.133306
Grimes, A. (2006). Are we
listening and learning? Understanding the nature of hemispherical
lateralisation and its application to marketing. International Journal of
Market Research, 48 (4), 439-457. https://doi.org/10.1177/147078530604800406
Hammond, R.W., Parvanta, C.,
& Zemen, R. (2022). Caught in the Act: Detecting Respondent Deceit and
Disinterest in On-Line Surveys. A Case Study Using Facial Expression Analysis. Social
Marketing Quarterly, 28 (1), 57-77. https://doi.org/10.1177/15245004221074403
Horská, E., & Berčík,
J. (2014). The Influence of Light on Consumer Behavior at the Food Market. Journal
of Food Products Marketing, 20 (4), 429-440. https://doi.org/10.1080/10454446.2013.838531
Massaro, A., Giannone, D.,
Birardi, V., & Galiano, A.M. (2021). An innovative approach for the
evaluation of the web page impact combining user experience and neural network
score. Future Internet, 13 (6). https://doi.org/10.3390/fi13060145
Krampe, C. (2022). The
application of mobile functional near-infrared spectroscopy for marketing
research – a guideline. European Journal of Marketing, 56 (13), 236-260.
https://doi.org/10.1108/EJM-01-2021-0003
Moya, I., & García-Madariaga,
J. (2022). Is a Video Worth More Than a
Thousand Images? A Neurophysiological Study on the Impact of Different Types of
Product Display on Consumer Behaviour in e-Commerce. In Martínez-López, F.J. &
L.F. Martinez (Eds), Advances in Digital Marketing and eCommerce. DMEC 2022.
Springer Proceedings in Business and Economics (pp. 300-306). Springer,
Cham. https://doi.org/10.1007/978-3-031-05728-1_32
Moya, I., García-Madariaga, J.,
& Blasco, M.F. (2020). What can neuromarketing tell us about food packaging? Foods, 9
(12). https://doi.org/10.3390/foods9121856
Ladkoo, A.D. (2020). Neuromarketing
and greenovation in festival and event tourism: The case of a small island
developing state-Mauritius. In Gursoy, D., R. Nunkoo & M. Yolal
(Eds), Festival and Event Tourism Impacts (pp. 221-233). Taylor and
Francis.
Lee, N., Chamberlain, L.,
& Brandes, L. (2018). Welcome to the jungle! The neuromarketing literature
through the eyes of a newcomer. European Journal of Marketing, 52(1–2), 4–38.
https://doi.org/10.1108/EJM-02-2017-0122
Levrini, G., Schaeffer, C.L.,
& Nique, W. (2020). The role of musical priming in brand recall. Asia
Pacific Journal of Marketing and Logistics, 32 (5), 1112-1131. https://doi.org/10.1108/APJML-04-2019-0231
Luna-Nevarez, C. (2018). An
Exploratory Analysis of Consumer Opinions, Ethics, and Sentiment of
Neuromarketing: An Abstract. Developments in Marketing Science: Proceedings
of the Academy of Marketing Science, 79-80. https://doi.org/10.1007/978-3-319-66023-3_32
Nielsen, J., & Molich, R.
(1990). Heuristic evaluation of user interfaces. CHI '90: Proceedings of the SIGCHI Conference
on Human Factors in Computing Systems, 249–256. https://doi.org/10.1145/97243.97281
Norman Acevedo, E., Quintana, H.,
& Ortegón Cortázar, L. (2015). Emotional arousal brands. A review of the color associated with
stimulation of Logos in the context of neuromarketing. Revista Espacios 36 (19):
17.
Ohme, R., Reykowska, D., Wiener, D., & Choromanska, A. (2009).
Analysis of Neurophysiological Reactions
to Advertising Stimuli by Means of EEG and Galvanic Skin Response Measures. Journal
of Neuroscience, Psychology, and Economics, 2 (1), 21-31. https://doi.org/10.1037/a0015462
Ohtawa, H., Tuneoka, M., &
Tsukada. W. (1970). Hitac-10. Japanese Journal of Medical Electronics and
Biological Engineering, 8 (1), 18-26. https://doi.org/10.11239/jsmbe1963.8.18
Pascucci,
F., Bartoloni, S., Ceravolo, M.G., Fattobene, L., Gregori, G.L., Pepa, L., Raggetti,
G., & Temperini, V. (2022). Exploring the relationships between perception of product quality,
product ratings, and consumers’ personality traits: An eye-tracking
study. Journal of Neuroscience, Psychology, and Economics, 15(2), 89-100. https://doi.org/10.1037/npe0000156
Pileliene, L., & Grigaliunaite,
V. (2017). Relationship between spokesperson’s gender and advertising color
temperature in a framework of advertising effectiveness. Scientific Annals
of Economics and Business, 64 (Specialissue), 1-13. https://doi.org/10.1515/saeb-2017-0036
Plassmann, H., Ramsøy, T.Z.,
& Milosavljevic, M. (2012). Branding the brain: A critical review and
outlook. Journal of Consumer Psychology, 22 (1), 18–36. https://doi.org/10.1016/J.JCPS.2011.11.010
Pupil Labs. (2016, september
23). A short review and primer on eye tracking in human computer interaction
applications. http://arxiv.org/abs/1609.07342
Ramsøy, T.Z. (2019). Building
a foundation for neuromarketing and consumer neuroscience research: How
researchers can apply academic rigor to the neuroscientific study of
advertising effects. Journal of Advertising Research, 59 (3), 281-294. https://doi.org/10.2501/JAR-2019-034
Revilla-Camacho, M.A.,
Cossío-Silva, F.J., & Mercado-Idoeta, C. (2018). Neuromarketing as a subject of legitimacy. In Díez-de-Castro, E. &
M. Peris-Ortiz (Eds), Organizational
Legitimacy: Challenges and Opportunities for Businesses and Institutions (pp. 105-119). Springer, Cham. https://doi.org/10.1007/978-3-319-75990-6_7
Ruiz, J., Serral, E., & Snoeck,
M. (2021). Unifying functional User
Interface design principles. International Journal of Human-Computer
Interaction, 27 (1). https://doi.org/10.1080/10447318.2020.1805876
Sałabun, W., Karczmarczyk,
A., & Mejsner, P. (2017). Experimental Study of Color Contrast Influence in
Internet Advertisements with Eye Tracker Usage. In Nermend, K. & M. Łatuszyńska
(Eds), Neuroeconomic and Behavioral Aspects of Decision Making. Springer
Proceedings in Business and Economics (pp. 365-375). Springer, Cham. https://doi.org/10.1007/978-3-319-62938-4_24
Savelli, E., Gregory-Smith, D.,
Murmura, F., & Pencarelli, T. (2022). How to communicate typical–local
foods to improve food tourism attractiveness. Psychology and Marketing, 39(7),
1350-1369. https://doi.org/10.1002/mar.21668
Sharma, D., & Nama, D.K. (2022).
Demystifying the role of neuromarketing in
creating value for the marketers. In Kaur, J., P. Jindal and A. Singh
(Eds), Developing Relationships, Personalization, and Data Herald in
Marketing 5.0 (pp. 109-129). IGI Global. https://doi.org/10.4018/978-1-6684-4496-2.ch007
Shneiderman, B. (2005). Leonardo’s
laptop: Human needs and the new computing technologies. CIKM '05: Proceedings of the 14th ACM
international conference on Information and knowledge management. Bremen, Germany: ACM
Digital Library, 2005. https://doi.org/10.1145/1099554.1099555
Singer, E. (2004). They know
what you want. New Scientist, 183 (2458), 36-37.
Stefko, R., Tomkova, A.,
Kovalova, J., & Ondrijova, I. (2021). Consumer purchasing behaviour and
neuromarketing in the context of gender differences. Journal of Marketing
Research and Case Studies, 2021. https://doi.org/10.5171/2021.321466
The Lancet Neurology. (2004). Neuromarketing:
Beyond branding. The Lancet Neurology, 3 (2), 71. https://doi.org/10.1016/S1474-4422(03)00643-4
Tinoco-Egas, R., Juanatey-Boga,
O., & Martínez-Fernández, V.A. (2020). Neuromarketing: Theoretical considerations and measurement tools. Revista Venezolana de Gerencia, 25 (90), 613-631. https://doi.org/10.37960/rvg.v25i90.32404
Wilson, T.D. (2002). Strangers
to Ourselves: Discovering the Adaptive Unconscious. The Belknap Press of
Harvard University Press.
Xu, Z., Zhang, M., Zhang, P., Luo,
J., Tu, M., & Lai, Y. (2023). The neurophysiological mechanisms underlying
brand personality consumer attraction: EEG and GSR evidence. Journal of
Retailing and Consumer Services, 73. https://doi.org/10.1016/j.jretconser.2023.103296
Zahmati, M., Azimzadeh, S.M.,
Sotoodeh, M.S., & Asgari, O. (2022). Effects of Endorsers Popularity and
Gender on the Audience’s Attention to the Advertisement from a Neuromarketing
Perspective: An Eye-Tracking Study. In Martínez-López, F.J. & L.F. Martinez
(Eds), Advances in Digital Marketing and eCommerce. DMEC 2022. Springer
Proceedings in Business and Economics. Springer, Cham. https://doi.org/10.1007/978-3-031-05728-1_29
